
| Butterflies | Moths | How you can help | Our work | Events |
Scottish Moth Flight Times and Distribution Maps
| |
Join Donate Identify | ||||||
|
|||||||
|
Scottish Moth Flight Times and Distribution Maps |
|||||||
|
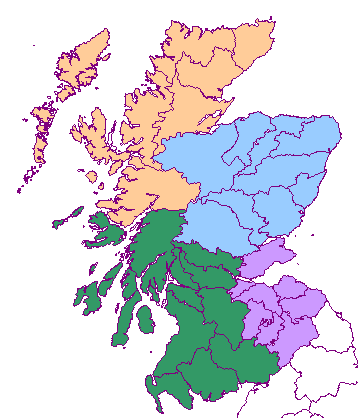
Compiled by Mark Cubitt The data used to create the content on this page is now getting rather dated (2021). More recent data is not currently available from Butterfly Conservation's NMRS database, but it has been requested and will hopefully be refreshed later in 2026. The table on this page lists many Scottish moths and includes a link to a chart showing the weekly occurrence of each species. This chart can be used as an aid for both determining when to search for moths and also to assist the identification by inclusion or exclusion of moths based on when they typically fly. The distribution maps include records from Cumberland and Northumberland to provide additional context; many thanks to the respective County Moth Recorders for their agreement to use these data. The flight times of moths are dependent on the climate of the location in which they inhabit. The climate affects both the temperature and other weather conditions and also the timing of key environmental factors such as growing times of food plants. The climate is affected by a location's latitude, altitude and proximity to the coast amongst other factors. The weather in a particular year may be quite different to the location's typical climate; this may affect a moth's flight time by a number of weeks. The flight time charts are shown by region in Scotland as shown on the map on the left below. (Orkney and Shetland records have not been included in the regional flight time charts.) These are based on data from the National Moth Recording Scheme supplied by Butterfly Conservation. Care should be exercised when interpreting the flight time charts particularly where there are small numbers of records in a week that may be due to records of non-adults or misidentifications some of which, although great effort has been taken to exclude these, will always be present in the data. Note that, particularly for scarce species, there are discrepancies in the two of types distribution maps. These tend to be where there are either unusable dates or unusable quantities in records. If the date isn't specific to a year then it can't go on the change maps and if it has no quantity then it can't go on the quantity map. The maps could exclude all records that fail either of these checks, but that would mean losing data unnecessarily albeit causing some maps inconsistency. The information below is based on data as held in the Butterfly Conservation administered National Macro Moth Recording Scheme database. Some of these data are still undergoing review by County Moth Recorders and central reviewers and so there will be some errors. They are also not absolutely current and may be well in excess of a year out of date. This is because submitted records need to be sent to the County Moth Recorder who will normally make an annual submission to the NMRS and these records then need to be checked and uploaded into the database. The information is currently based on data from an NMRS Extract with data mostly up to the end of 2020 or 2021 for some vice counties, as shown in the right hand map below. Many CMRs have submitted more recent data, but these may not have been uploaded into the NMRS database as those VCs previously without updates since 2016 have been prioritised.
The Quantity Map uses the cumulative number of moths of that species recorded in a 10 km square. In order to avoid misleading values due to very large numbers of a species being recorded in a session, such as thousands of Burnet moths, the algorithm moderates the number for each session to a maximum of twenty. The numbers need to be treated with caution as they are highly biased by observer effort and so squares with Rothamsted traps of long-standing observers will often look like hot-spots. See the NMRS Moth Recording Sessions map to get a view on observer effort. The Change Map shows the 10km squares based on when the species have been recorded before the year 2000, both before and after and only after 2000. In areas with low recording effort that fact that a species has only been seen before or since 2000 is not necessarily a range contraction or expansion. The distribution of moths shown on maps on this website and elsewhere is influenced, in some cases strongly, by the variation in recording effort geographically. The Macro Moth 10k Squares page shows heat map style categorisation of the number of species recorded in each square. The Species Trend charts show the numbers of each species relative to the number of all other species recorded during its flight period. It does not show trends in the overall numbers of moths over time. It is calculated based on the total quantity of a species recorded with non zero counts each year, normalised against the total quantity of all species records in that region within the flight period of the species involved. Some compensation across years is therefore made for variations in recording effort and for generally good or bad observation conditions. Some particularly high counts, especially of day flying moths can disrupt the charts at the bar heights are set so that the maximum bar height is set to the height of the chart for each region. The total quantity of the species recorded since 1970 is shown in parentheses after the species name.
|
